जॉइन Examsbook
पार्क B, C और D में पुरुष जनसंख्या का औसत क्या है?
5Directions: Given table shows the data of population in 5 different parks. Study the data carefully and answer the questions.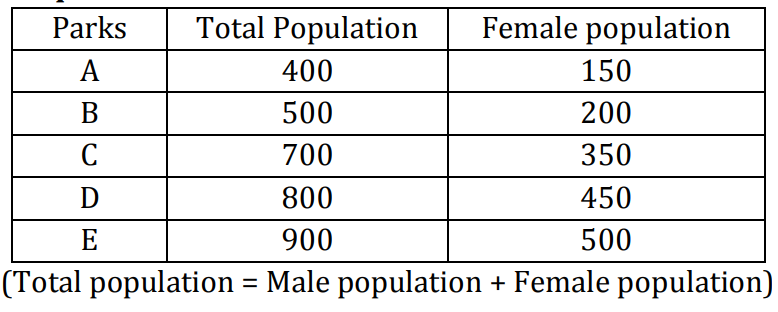
प्र:
पार्क B, C और D में पुरुष जनसंख्या का औसत क्या है?
- 1343.33false
- 2313.33false
- 3323.33false
- 4333.33true
- 5353.33false
- उत्तर देखें
- Workspace