जॉइन Examsbook
वर्ष 1994 से 1998 के बीच खर्च की साधारण विकास दर औसतन क्या थी।
5Directions: The following graph gives Sales, Expense and Capital of a company for a period of five years 1994 to 1998. Read the graph and answer the following questions.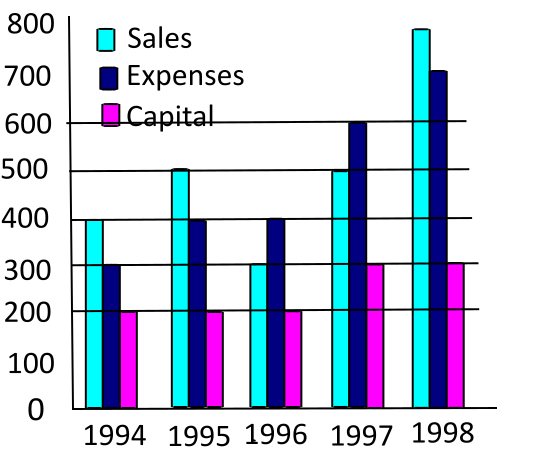
प्र:
वर्ष 1994 से 1998 के बीच खर्च की साधारण विकास दर औसतन क्या थी।
- 125%true
- 233%false
- 340%false
- 4130%false
- उत्तर देखें
- Workspace