जॉइन Examsbook
वर्ष 2009 और 2011 में टाइप P वाहनों का कुल उत्पादन वर्ष 2010 और 2014 में टाइप Q वाहनों के कुल उत्पादन का कितना प्रतिशत है?
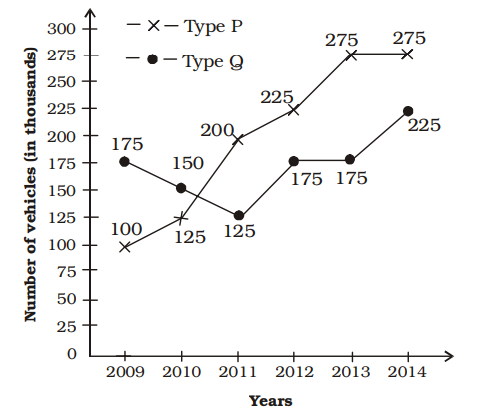
5Directions : The following graph shows production (in thousands) of two types (P and Q) of vehicles by a factory over the years 2009 to 2014. Study the graph and answer the given questions.
प्र:
वर्ष 2009 और 2011 में टाइप P वाहनों का कुल उत्पादन वर्ष 2010 और 2014 में टाइप Q वाहनों के कुल उत्पादन का कितना प्रतिशत है?
- 175false
- 269.25false
- 380true
- 481.25false
- उत्तर देखें
- Workspace