जॉइन Examsbook
दो वर्षों 2010 और 2013 में सोने की कीमतों का अनुपात है
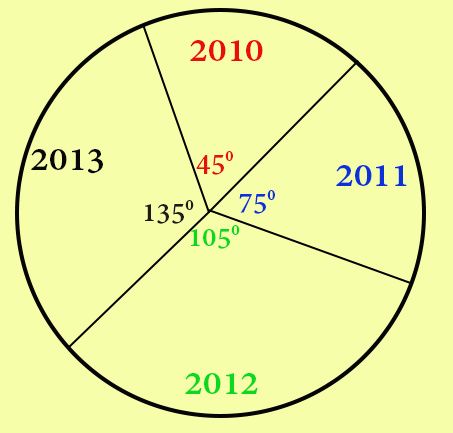
5Directions : Given here is a pie chart showing the cost of gold in 2010, 2011, 2012 and 2013. Study the chart and answer the following questions
प्र:
दो वर्षों 2010 और 2013 में सोने की कीमतों का अनुपात है
- 11 : 2false
- 21 : 3true
- 31 : 4false
- 41 : 5false
- उत्तर देखें
- Workspace