Join Examsbook
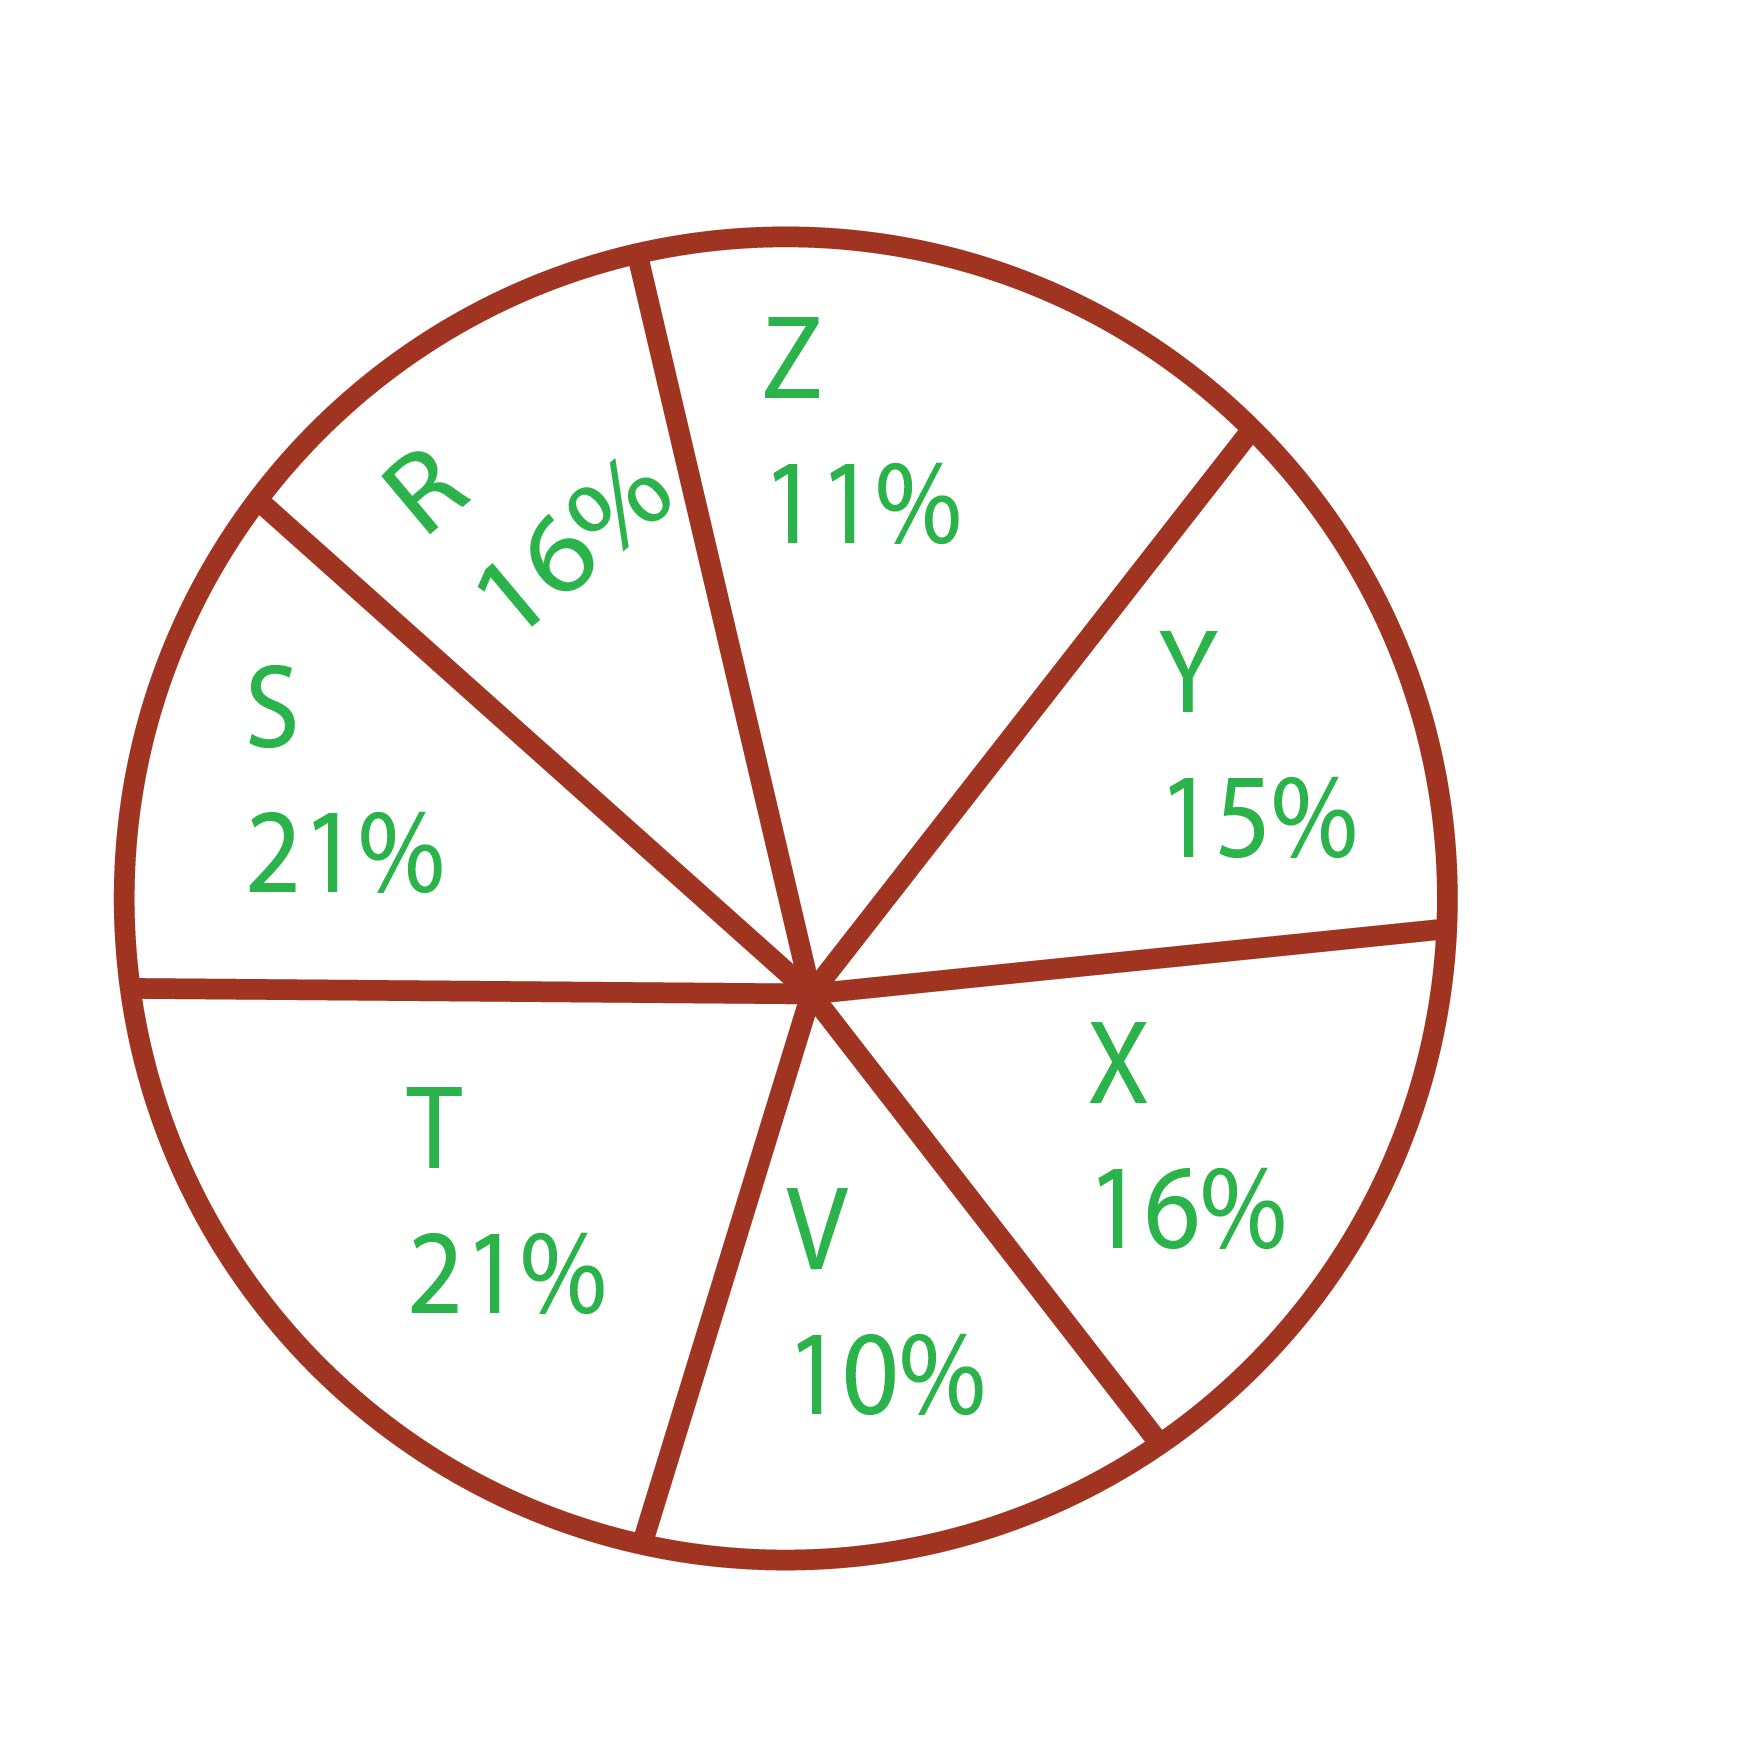
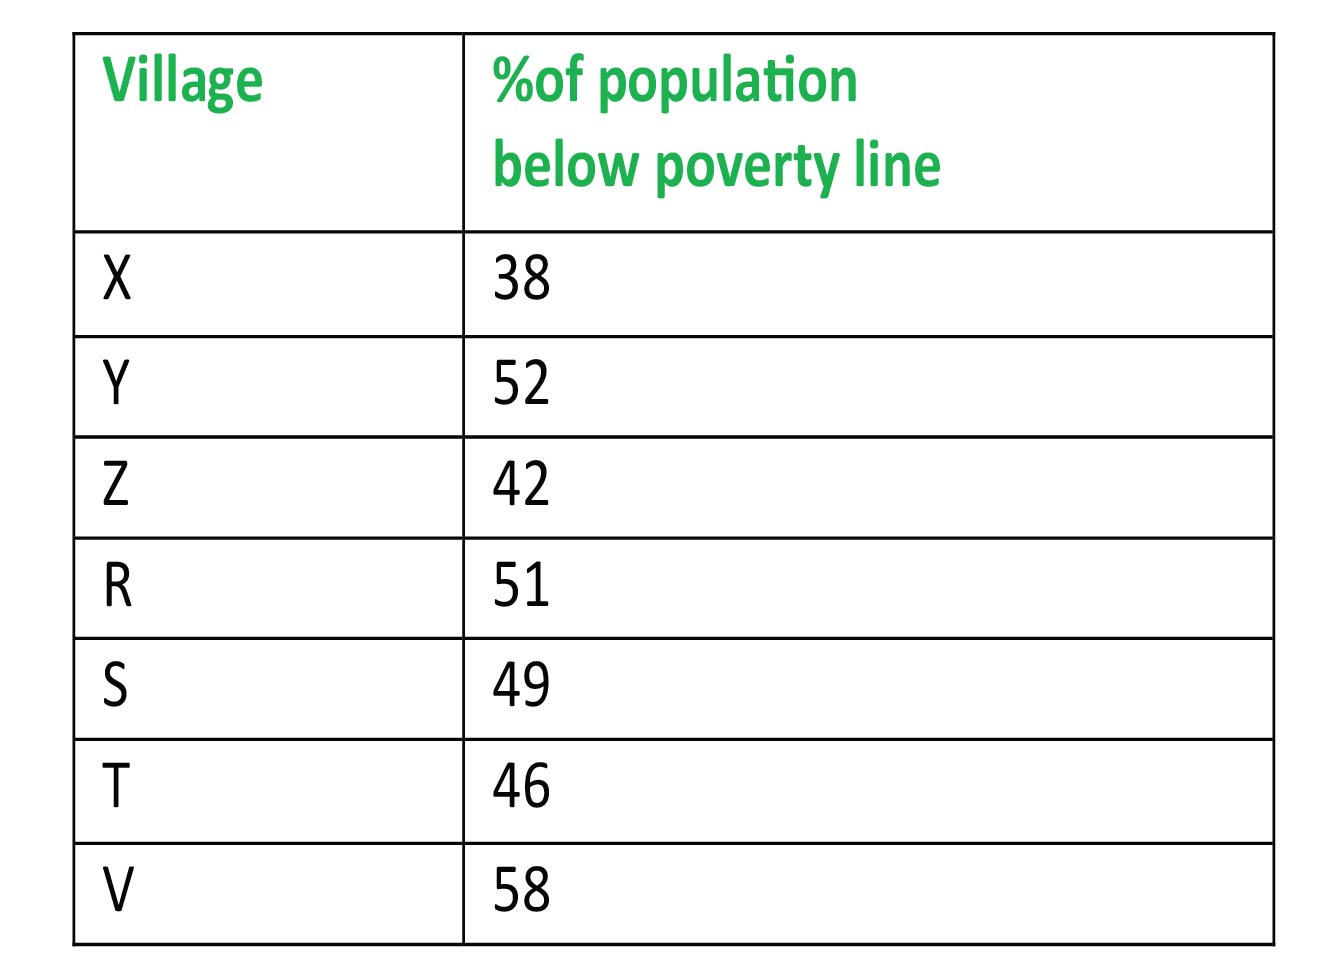
गाँव "T" की गरीबी रेखा से नीचे की आबादी तथा गाँव 'Z' की गरीबी रेखा से नीचे की आबादी का अनुपात कितना है?
5Directions: The following pie chart show proportion of population of seven villages in 2009. Stud the pie chart and answer question that follows:


Q:
गाँव "T" की गरीबी रेखा से नीचे की आबादी तथा गाँव 'Z' की गरीबी रेखा से नीचे की आबादी का अनुपात कितना है?
- 111: 23false
- 213: 11false
- 323: 11true
- 411:13false
- Show Answer
- Workspace

