जॉइन Examsbook
उस वर्ष ग्लूकोज बिस्कुट के उत्पादन और बिस्कुट के कुल उत्पादन का अनुपात अधिकतम था
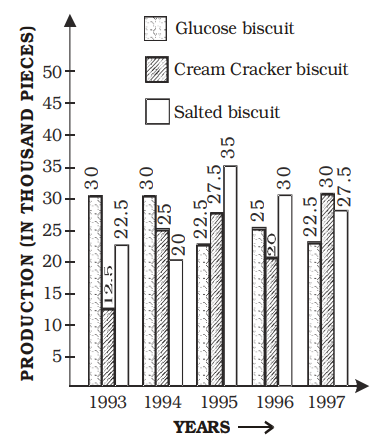
5Directions: The bar diagram given below shows the productions (in the unit of thousand pieces) of three types of biscuits by a company in the five consecutive years. Study the diagram and answer the following questions.
प्र:
उस वर्ष ग्लूकोज बिस्कुट के उत्पादन और बिस्कुट के कुल उत्पादन का अनुपात अधिकतम था
- 11994false
- 21993false
- 31996false
- 41997true
- उत्तर देखें
- Workspace