जॉइन Examsbook
उत्तर : 4. "
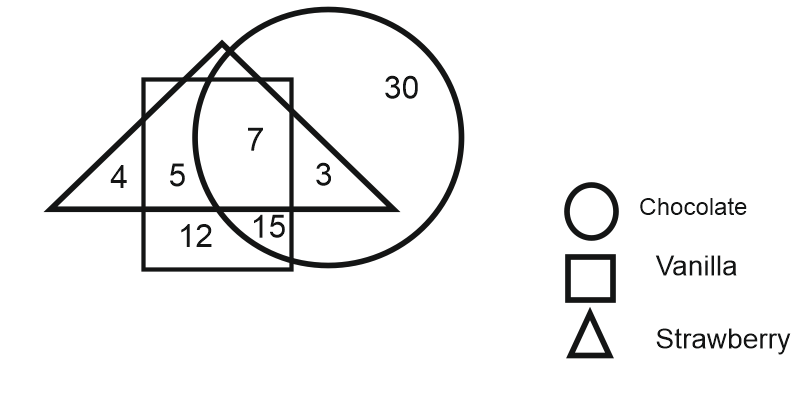
चॉकलेट पसंद करने वालों के लिए वेनिला पसंद करने वाले बच्चों का अनुपात है:
5Direction: Study the following diagram and answer question based on it-
The diagram represents the favourite ice-cream flavours of kids in a society
प्र:
चॉकलेट पसंद करने वालों के लिए वेनिला पसंद करने वाले बच्चों का अनुपात है:
- 1false
- 2false
- 3false
- 4true
- उत्तर देखें
- Workspace


