जॉइन Examsbook
कंपनी A का उत्पादन, कंपनी C के माँग का कितना प्रतिशत है?
5Directions : The graph shows the demand and production of different companies. Study the graph and answer the following questions.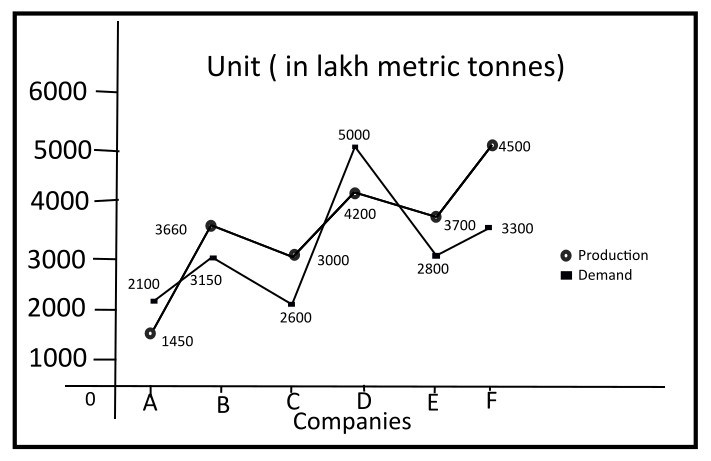
प्र:
कंपनी A का उत्पादन, कंपनी C के माँग का कितना प्रतिशत है?
- 150%false
- 260%false
- 355 %true
- 465%false
- उत्तर देखें
- Workspace