जॉइन Examsbook
भोजन पर व्यय की गयी आय का प्रतिशत है ?
5Directions: The bar graph given below shows the spending of family income on various items and savings during 1993. Observe the graph and answer the following questions: 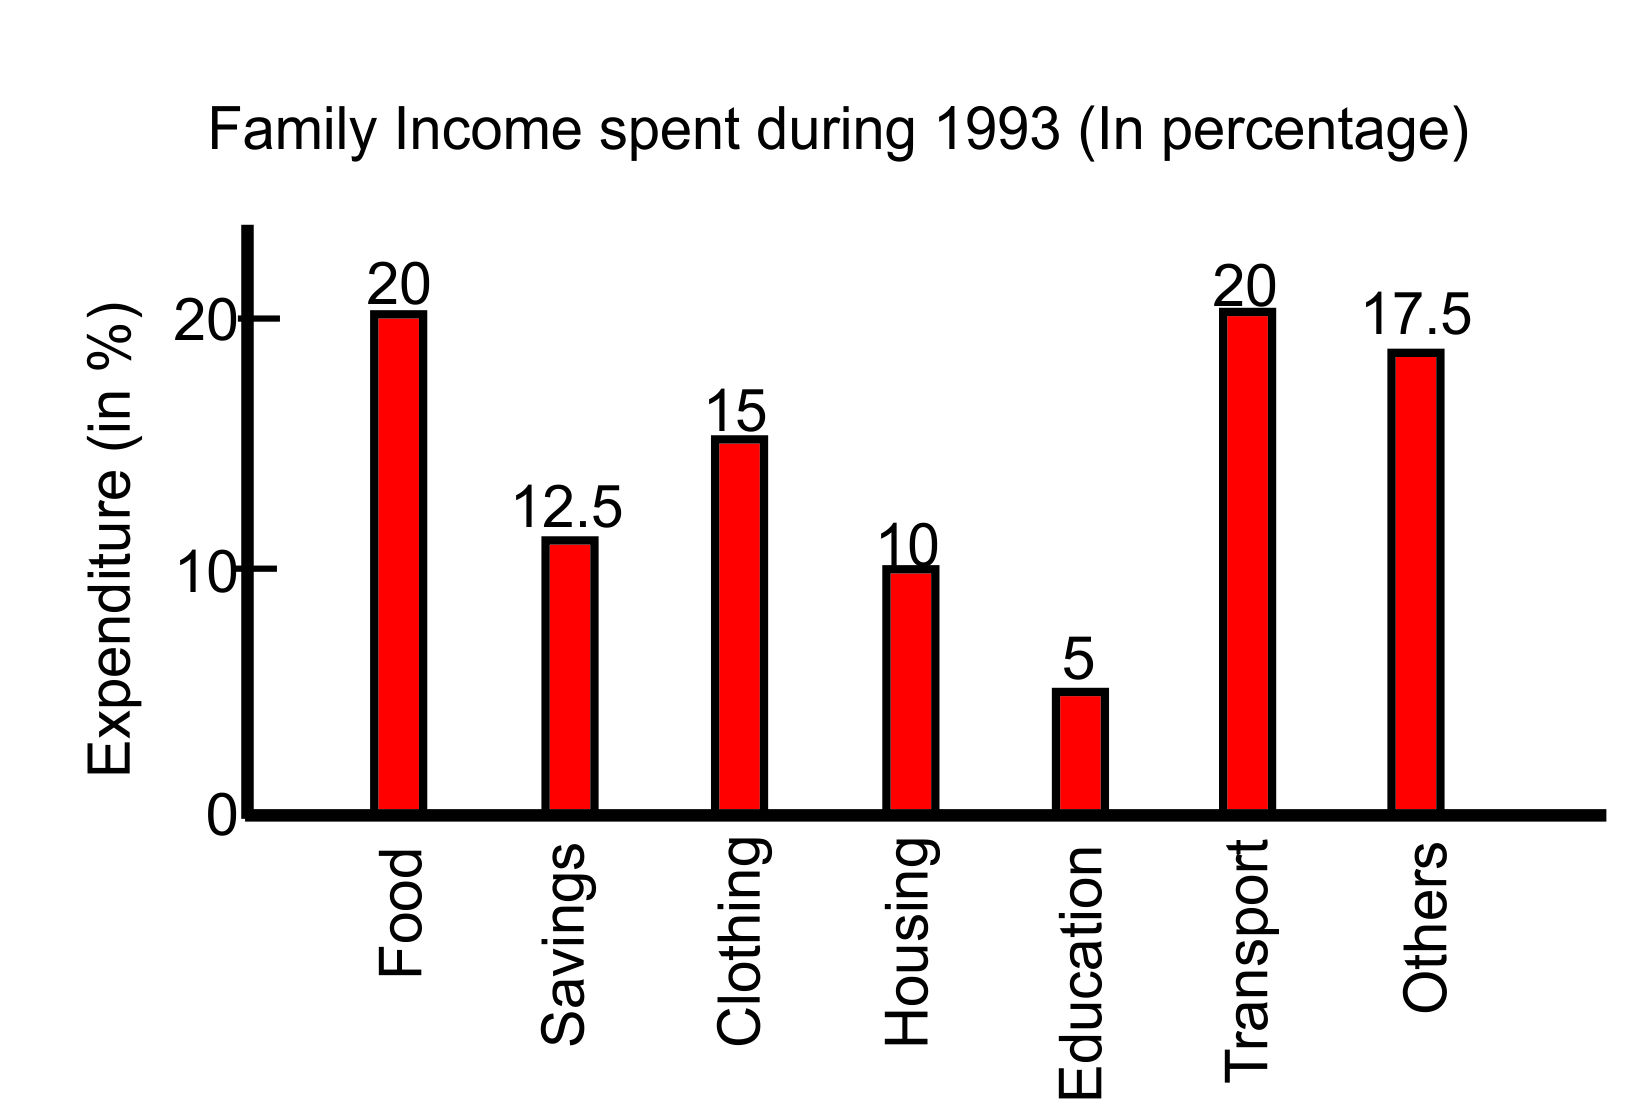
प्र:
भोजन पर व्यय की गयी आय का प्रतिशत है ?
- 15 %false
- 210 %false
- 312.5 %false
- 420 %true
- उत्तर देखें
- Workspace