जॉइन Examsbook
स्कूल E में छात्रों की संख्या स्कूल A और B में छात्रों की कुल संख्या से अधिक है, जहां x के बीच स्थित है:
5Study the given pie chart and answer the question that follows.
Distribution (Degree wise) of students studying in schools A, B, C, D and E
Total Number of students =9000
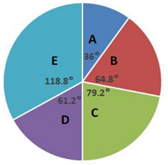
प्र:
स्कूल E में छात्रों की संख्या स्कूल A और B में छात्रों की कुल संख्या से अधिक है, जहां x के बीच स्थित है:
- 1440 and 460true
- 2420 and 440false
- 3460 and 480false
- 4400 and 420false
- उत्तर देखें
- Workspace