जॉइन Examsbook
उत्तर : 2. "
B द्वारा बेचे गए उत्पादों की संख्या 2011 और 2014 से कितने प्रतिशत बढ़ी?
5Directions :- Refer the graph and answer the given questions.
The following line graph shows the number of products sold by company A and B during six years.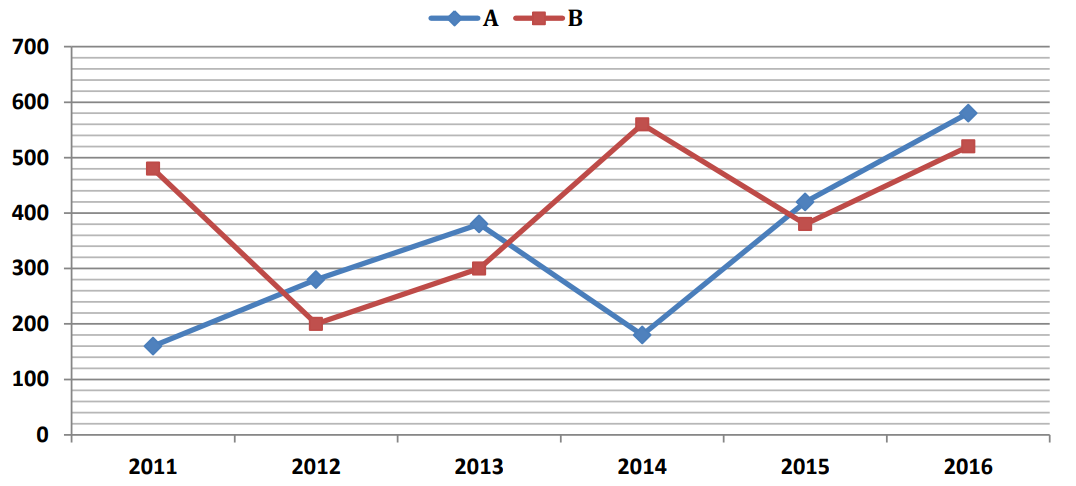
प्र:
B द्वारा बेचे गए उत्पादों की संख्या 2011 और 2014 से कितने प्रतिशत बढ़ी?
- 1false
- 2true
- 3false
- 4false
- 5false
- उत्तर देखें
- Workspace