जॉइन Examsbook
विभिन्न व्यवसायों में शामिल लोगों की अधिकतम संख्या और शामिल लोगों की न्यूनतम संख्या के बीच का अंतर है
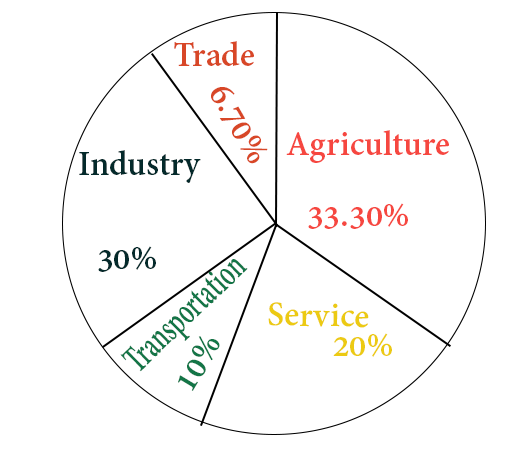
5Directions : Study the following pie chart carefully and answer the questions. The pie chart represents the percentage of people involved in various occupations.
Total number of people = 20000
प्र:
विभिन्न व्यवसायों में शामिल लोगों की अधिकतम संख्या और शामिल लोगों की न्यूनतम संख्या के बीच का अंतर है
- 12640false
- 23640false
- 36320false
- 45320true
- उत्तर देखें
- Workspace