जॉइन Examsbook
The average number type A, B and D vehicles exported in 2015 was x% less than the number of type E vehicles exported in 2014. What is the value of x?
5Direction: The given Bar Graph Presents the number of different types of vehicles (in lakhs) exported by a company during 2014 and 2015.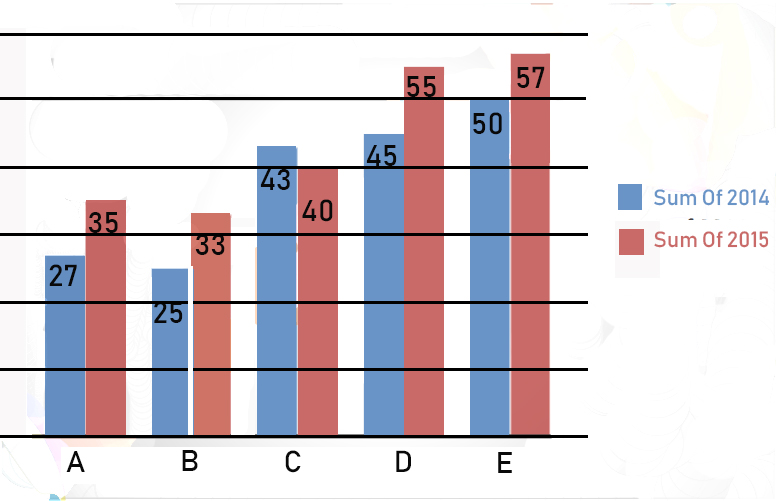
प्र:
The average number type A, B and D vehicles exported in 2015 was x% less than the number of type E vehicles exported in 2014. What is the value of x?
- 120false
- 225false
- 318true
- 424false
- उत्तर देखें
- Workspace