Join Examsbook
कितने वर्षों में जारी किए गए वर्क वीजाओं की संख्या पिछले वर्षों की तुलना में अधिक थी ?
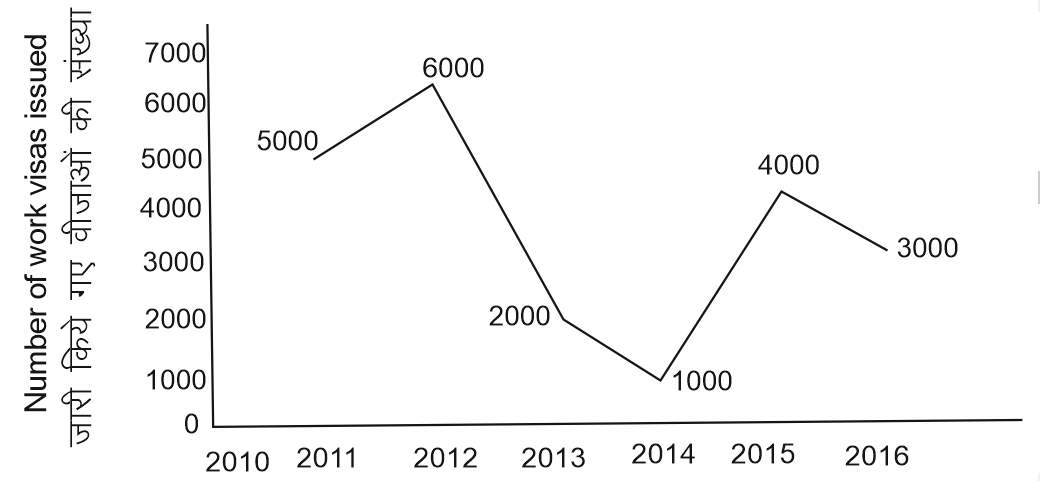
5Directions: The line graph shows the number of work visas issued by a country in each year from 2011 to 2016. Study the diagram and answer the following questions .
Q:
कितने वर्षों में जारी किए गए वर्क वीजाओं की संख्या पिछले वर्षों की तुलना में अधिक थी ?
- 11false
- 23false
- 34false
- 42true
- Show Answer
- Workspace