जॉइन Examsbook
किस वर्ष में अधिकतम रिक्तियां उत्पादित हुई?
5The line graph shows the number of vacancies of accountants in a certain company. Study the diagram and answer the following questions.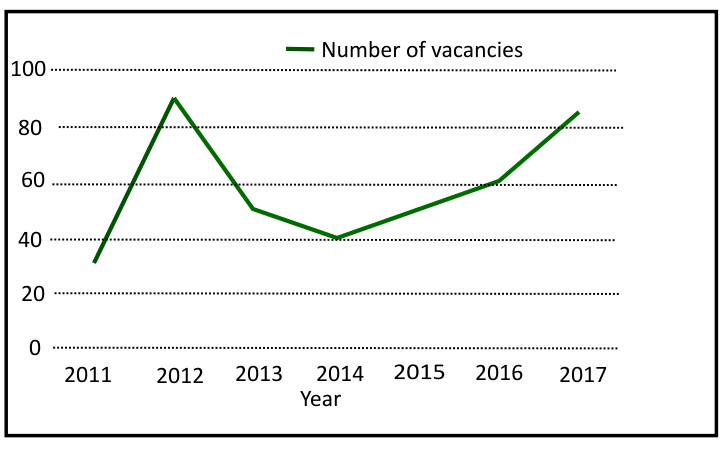
प्र:
किस वर्ष में अधिकतम रिक्तियां उत्पादित हुई?
- 12012, 2017true
- 22014, 2016false
- 32013, 2016false
- 4इनमें से कोई नहींfalse
- उत्तर देखें
- Workspace