जॉइन Examsbook
निम्न में से किस वर्ष लैपटॉप का उत्पादन , उसी वर्ष मोबाइल , कम्प्यूटर तथा लैपटॉप के उत्पादन का ठीक 40 % है ?
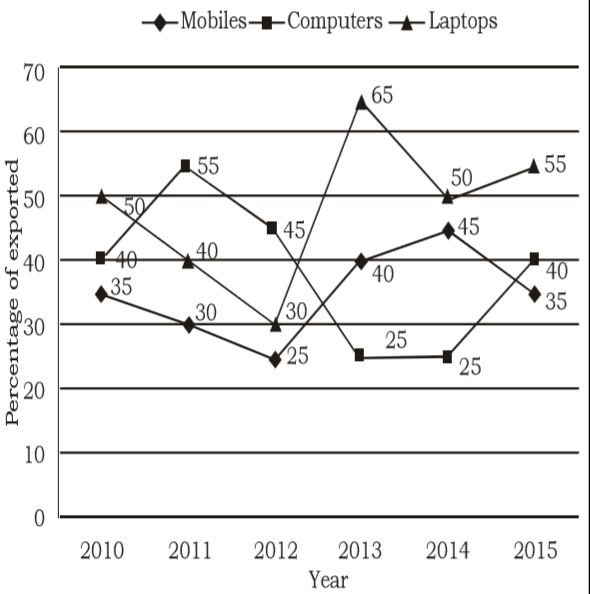
5Direction: Study the line graph carefully to answer the following questions.
Line graph shows the production (in thousand units) and percentage of exported mobiles, computers and laptops.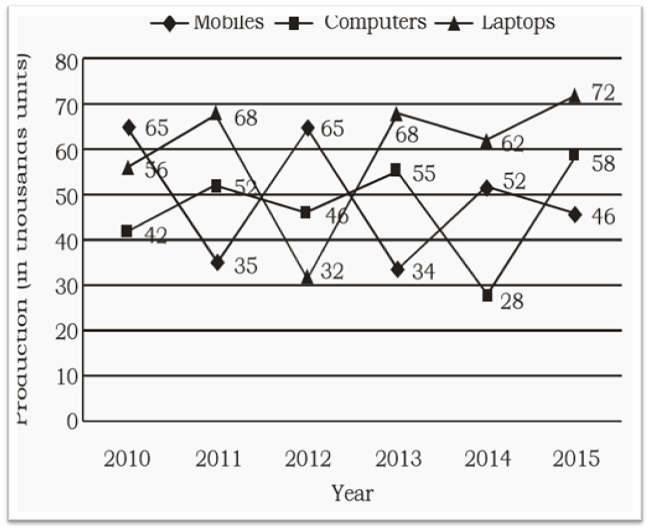
प्र:
निम्न में से किस वर्ष लैपटॉप का उत्पादन , उसी वर्ष मोबाइल , कम्प्यूटर तथा लैपटॉप के उत्पादन का ठीक 40 % है ?
- 12011false
- 22012false
- 32015false
- 42014false
- 5इनमें से कोई नहींtrue
- उत्तर देखें
- Workspace