जॉइन Examsbook
श्रेणी A, में महिला श्रमिकों के लिए पुरुष श्रमिकों का अनुपात 2: 3 है श्रेणी A में महिला श्रमिकों की संख्या श्रेणी F में श्रमिकों की कुल संख्या का कितना प्रतिशत है?
5Directions: Study the following pie chart carefully and answer the questions given beside.
The following pie chart gives the information about breakup of six different categories of workers in a company.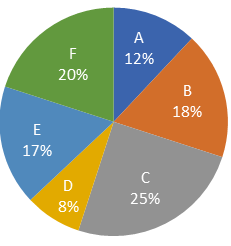
प्र:
श्रेणी A, में महिला श्रमिकों के लिए पुरुष श्रमिकों का अनुपात 2: 3 है श्रेणी A में महिला श्रमिकों की संख्या श्रेणी F में श्रमिकों की कुल संख्या का कितना प्रतिशत है?
- 135.5%false
- 238%false
- 337.5%false
- 436%true
- उत्तर देखें
- Workspace