जॉइन Examsbook
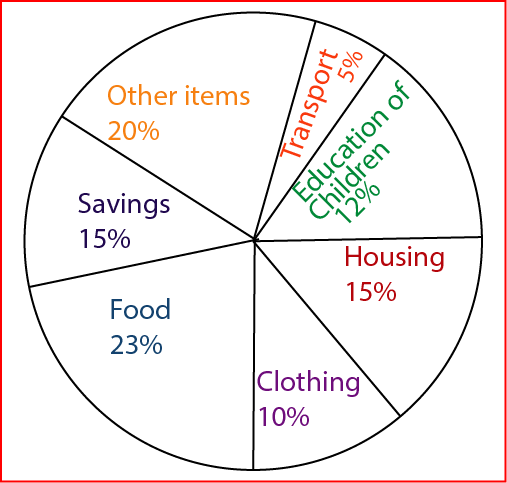
यदि वर्ष के लिए कुल आय 1,00,000 थी, आवास और परिवहन के बीच व्यय (रुपयों में) का अंतर था
5Directions: The pie chart drawn below shows the expenses of a family on various items and its savings during the year 2001. Study the graph and answer the questions.
Percent of money spent on various items and savings by a family during 2001
प्र:
यदि वर्ष के लिए कुल आय 1,00,000 थी, आवास और परिवहन के बीच व्यय (रुपयों में) का अंतर था
- 1₹ 7000false
- 2₹ 10000true
- 3₹ 15000false
- 4₹ 12000false
- उत्तर देखें
- Workspace