जॉइन Examsbook
पाठयक्रम C में उत्तीर्ण विधार्थी कितने है?
5The given pie chart shows the percentage of students enrolled for the courses A, B, C, D and E in a university and the table shows the percentage of students that passed, out of the enrolled students.
Total Students=60,000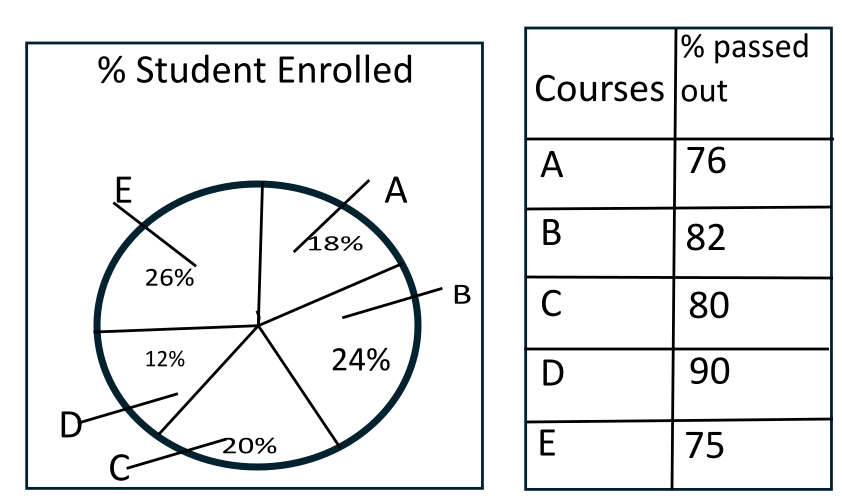
प्र:
पाठयक्रम C में उत्तीर्ण विधार्थी कितने है?
- 18800false
- 29600true
- 37300false
- 46800false
- उत्तर देखें
- Workspace