जॉइन Examsbook
ग्राफ के अनुसार अधिकतम राशि किस पर खर्च की गई।
5Pie chart shows the percent of money spent by family on various item during 1999. Study the graph and answer these questions.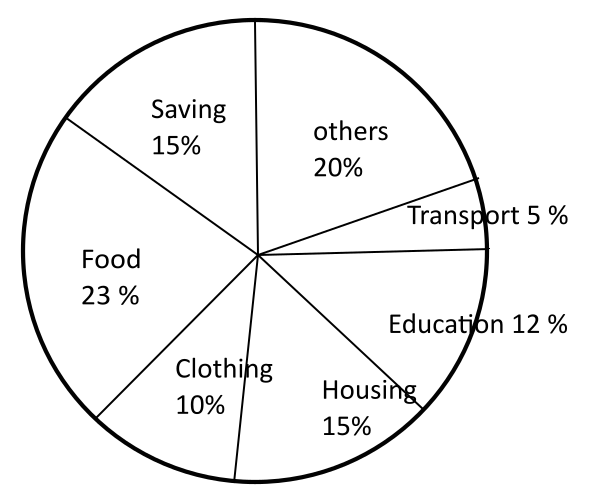
प्र:
ग्राफ के अनुसार अधिकतम राशि किस पर खर्च की गई।
- 1भोजनtrue
- 2कपड़ेfalse
- 3घरfalse
- 4अन्यfalse
- उत्तर देखें
- Workspace