Join Examsbook
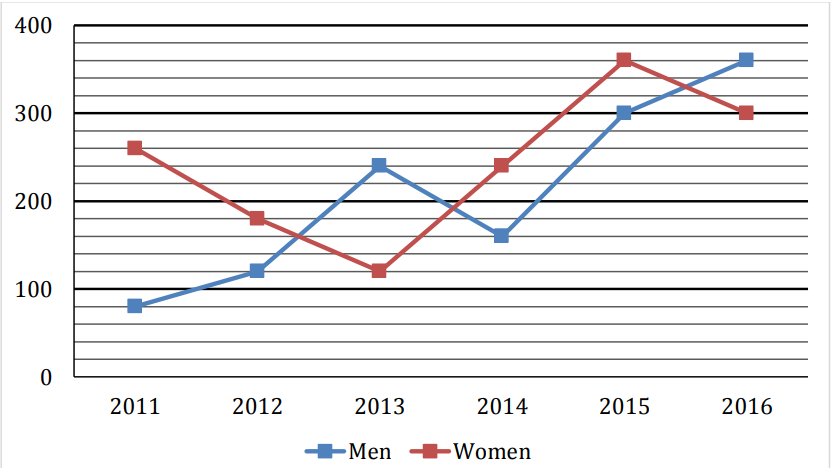
2012 और 2013 में एक साथ काम करने वाले कुल मजदूरों की संख्या का अनुपात 2015 और 2016 में एक साथ काम करने वाले कुल मजदूरों के बीच का अनुपात ज्ञात कीजिए?
5Direction: The line chart given below shows the number of labors (men and women) working in six different years. Study the data carefully and answer the following questions.
Q:
2012 और 2013 में एक साथ काम करने वाले कुल मजदूरों की संख्या का अनुपात 2015 और 2016 में एक साथ काम करने वाले कुल मजदूरों के बीच का अनुपात ज्ञात कीजिए?
- 135 : 66false
- 211 : 10false
- 32 : 1false
- 41 : 2true
- 5दिए गए विकल्पों में से कोई भी नहींfalse
- Show Answer
- Workspace

