Join Examsbook
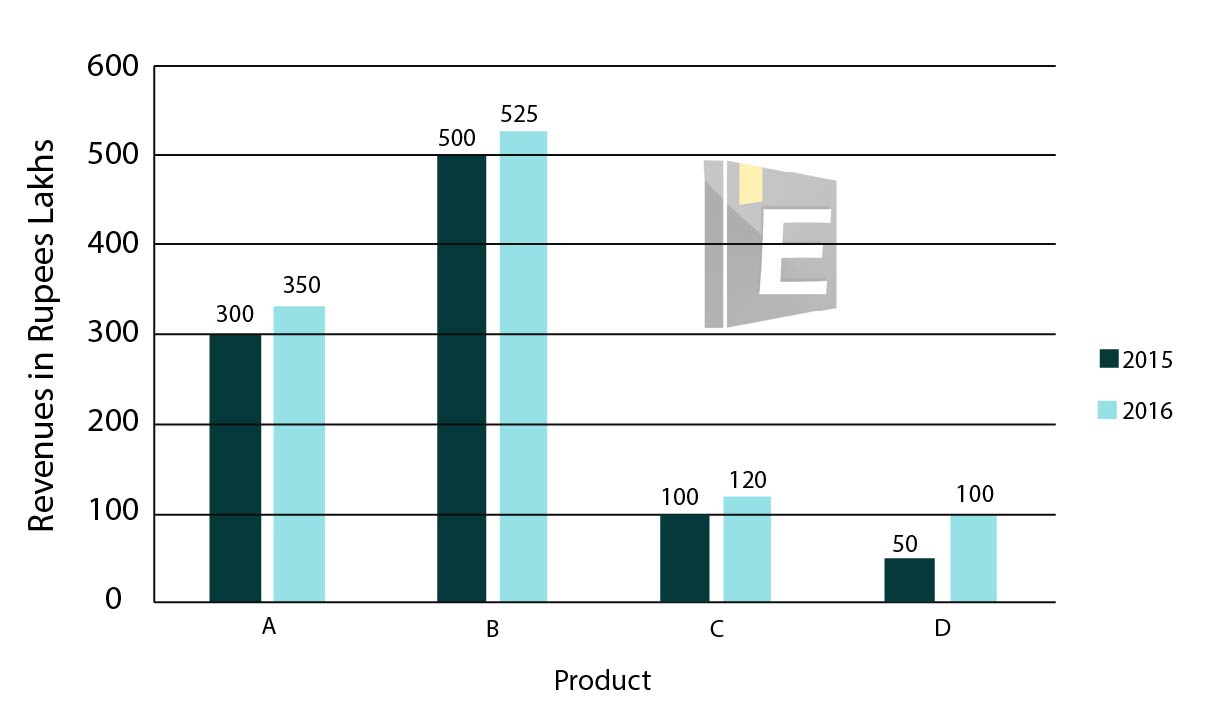
वर्ष 2016 में सभी चार उत्पादों की बिक्री से प्राप्त कुल आय, वर्ष 2015 की तुलना में कितनी अधिक (करोड़ रूपये में) है?
5Direction: The bar graph shows revenues in rupees lakhs from selling four different products (A, B, C and D) by a certain company. Study the diagram and answer the following questions.
Q:
वर्ष 2016 में सभी चार उत्पादों की बिक्री से प्राप्त कुल आय, वर्ष 2015 की तुलना में कितनी अधिक (करोड़ रूपये में) है?
- 11.5false
- 21.25true
- 31false
- 41.75false
- Show Answer
- Workspace